Win rate
63.4%
Every TradingView signal logged automatically — live P&L, drawdown, and an execution-parameter optimizer running on real market data, not curve-fit history.
● Free tier live · 30-day history · connects in minutes
Stop relying on curve-fit history. Verify your edge against live market volatility, spreads, and execution reality — before the risk is real.
Tested against live data with actual spreads, slippage, and volatility — no simulated fills, no idealized assumptions.
The trades already happened out-of-sample. If it works forward, it works — no cherry-picked historical window to hide behind.
Every trade is captured from the source alert, with duplicates filtered automatically. No edited entries, no quietly deleted losers.
Alerts captured 24/7 via webhook with built-in dedup — no manual logging, no missed trades, no human error.
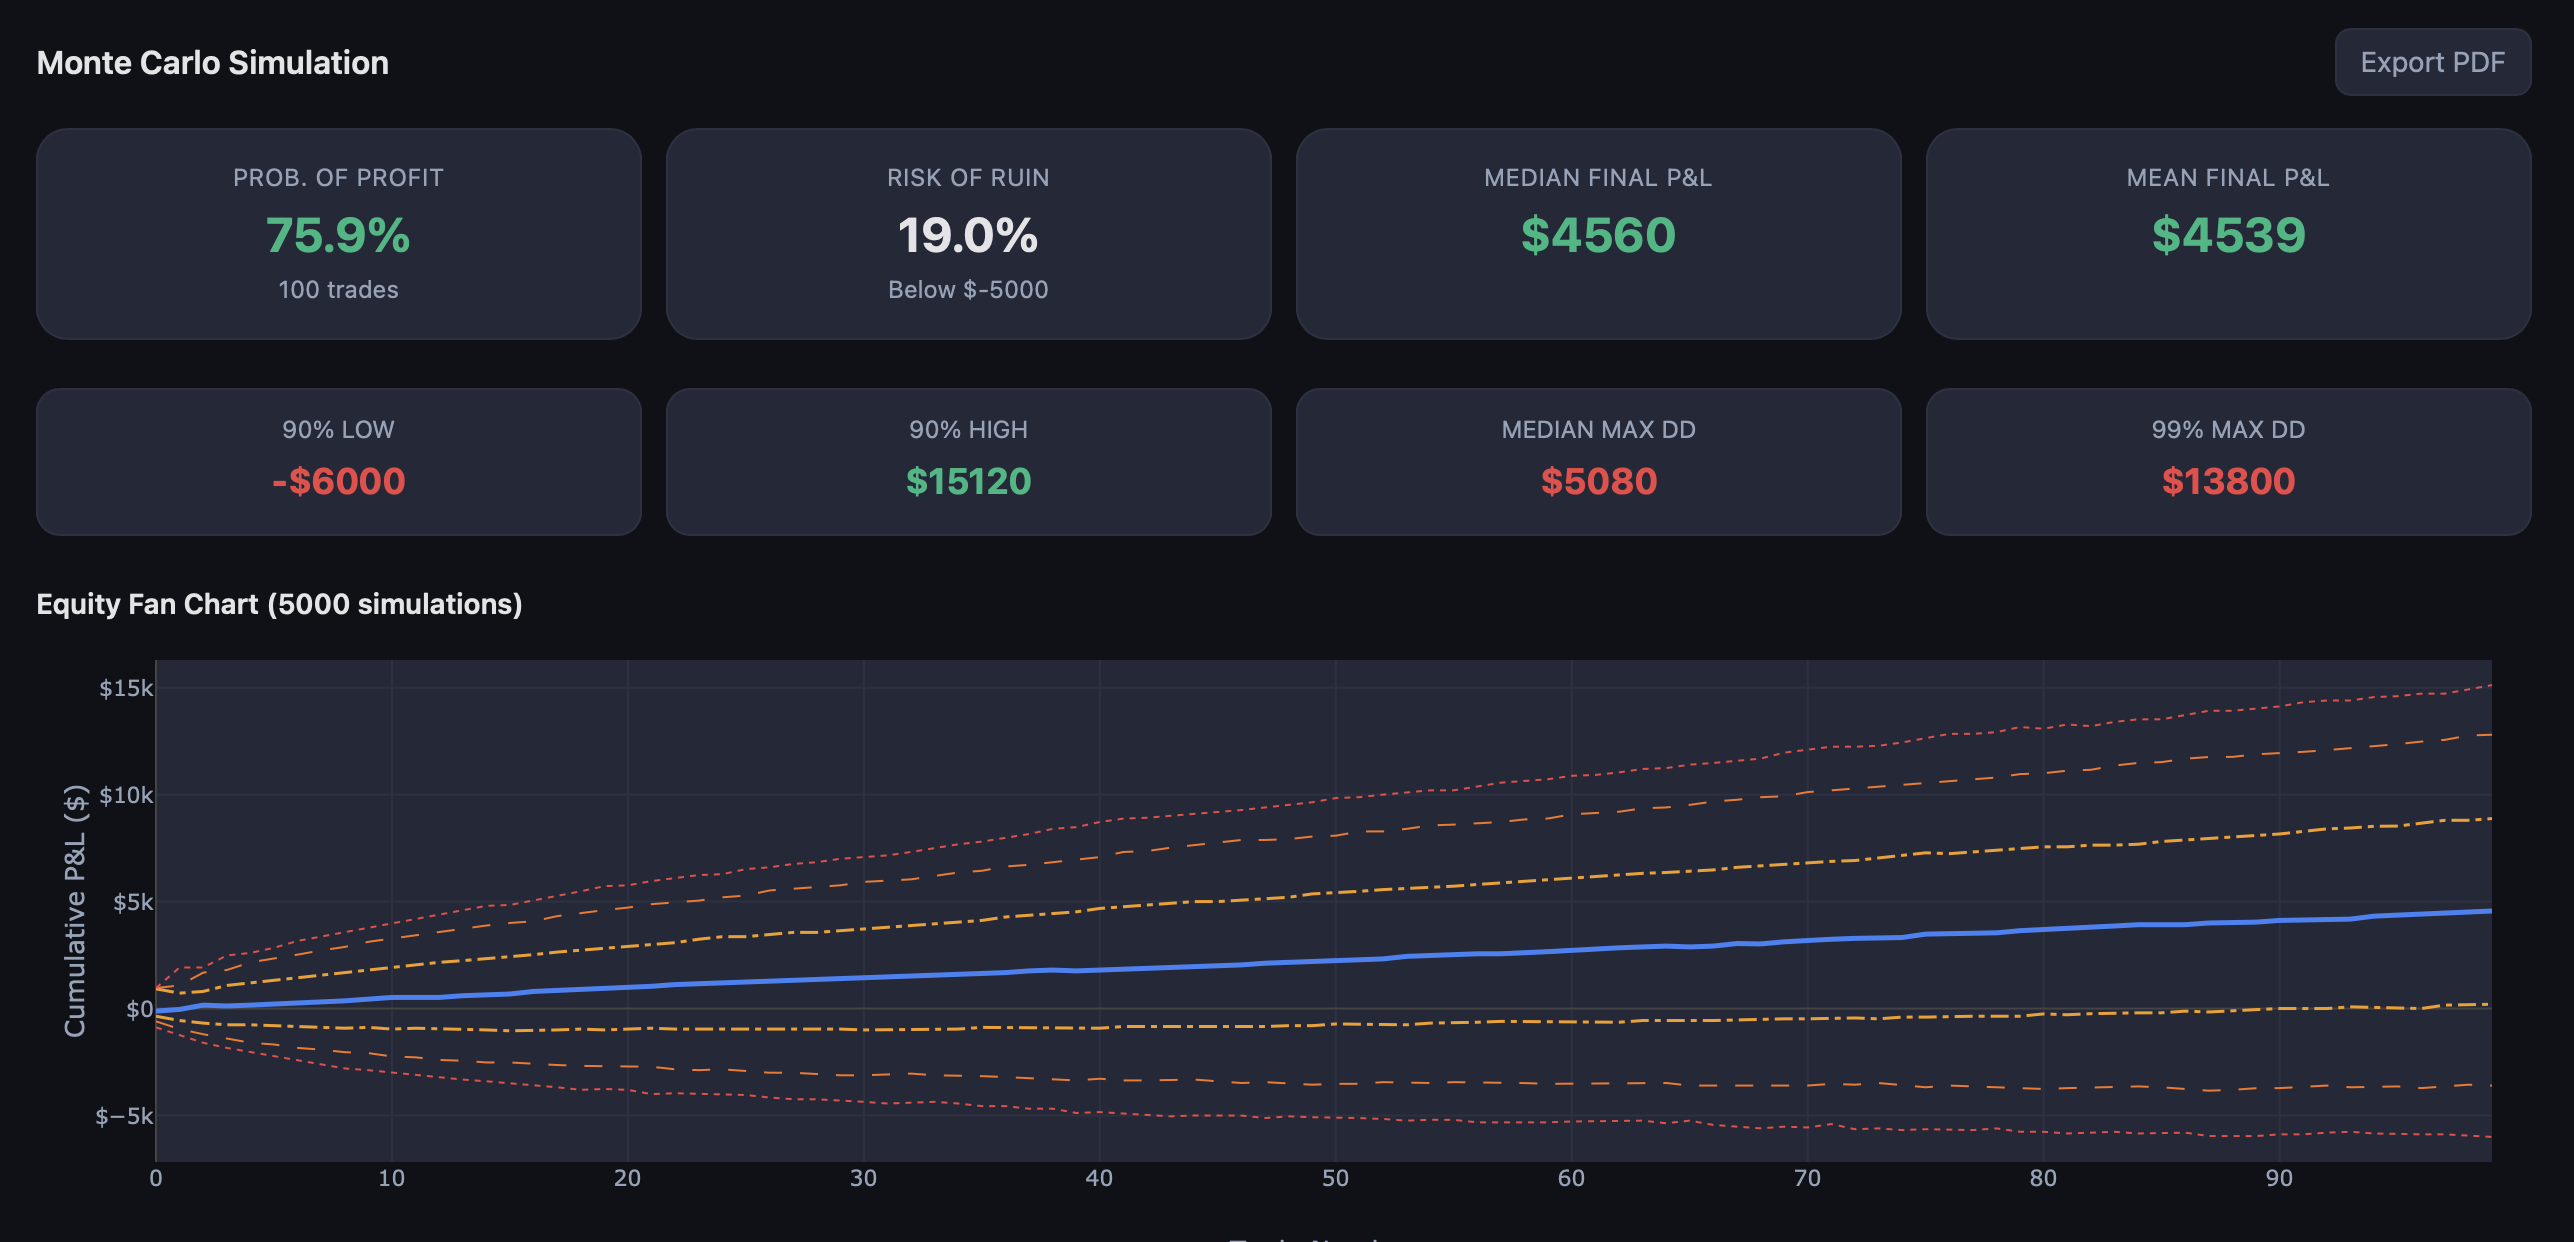
Institutional-grade metrics including Spearman correlation, Monte Carlo risk of ruin, and Walk-Forward Efficiency — all calculated automatically.
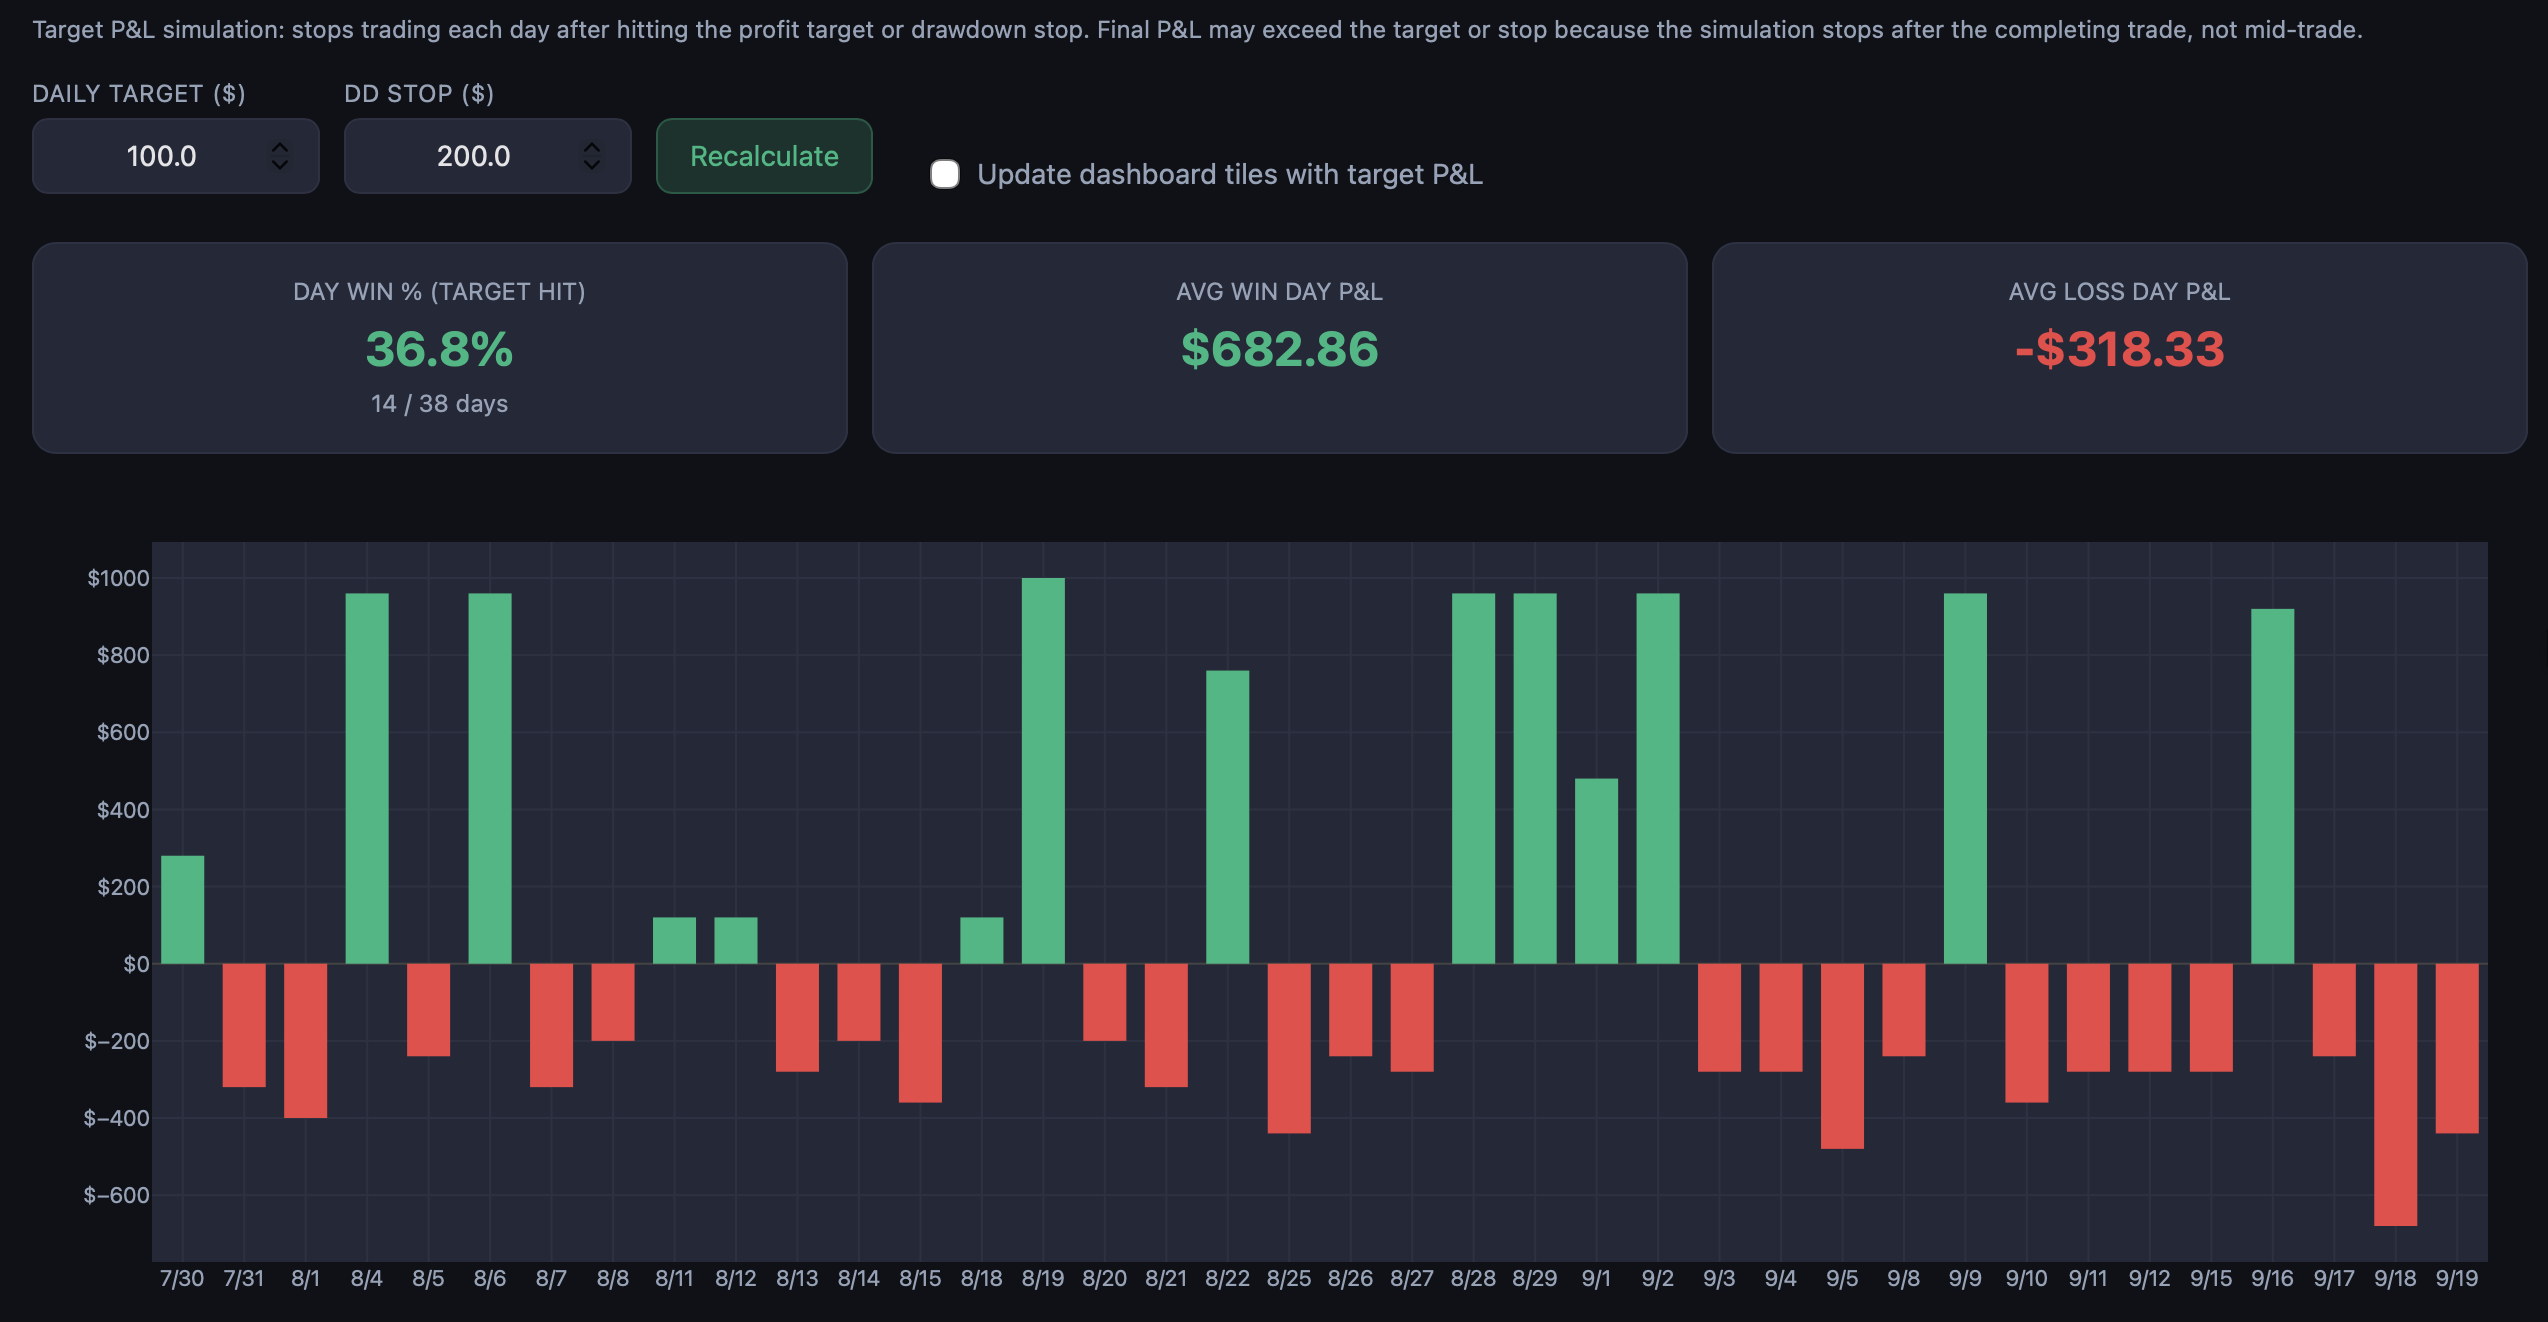
Pinpoint the optimal profit target, stop, and time-filter from your actual forward-test history — not the noise of simulated fills.
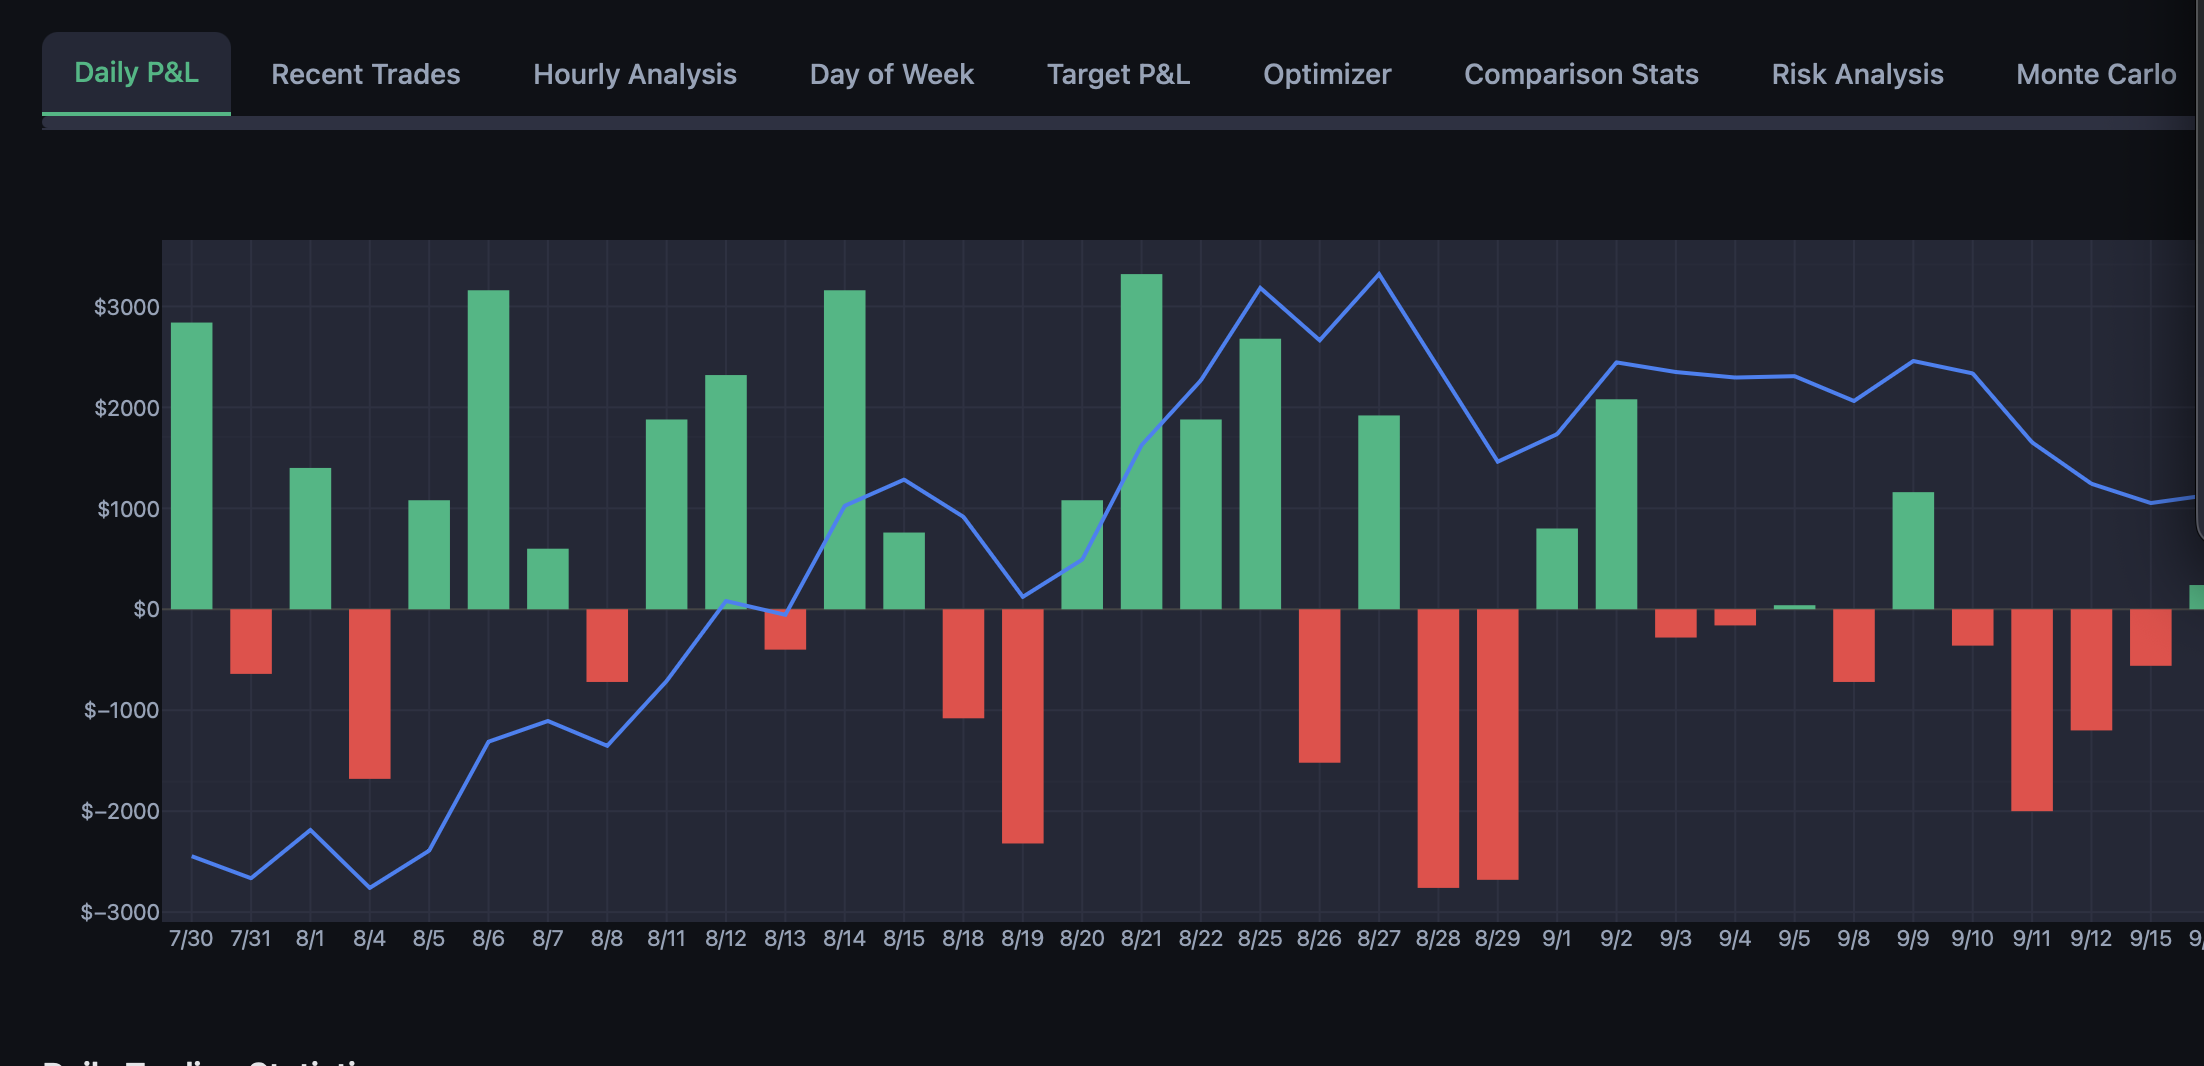
The moment a signal fires, your equity curve, win rate, drawdown, and per-session breakdown update — served from pre-computed trades, so it loads fast.
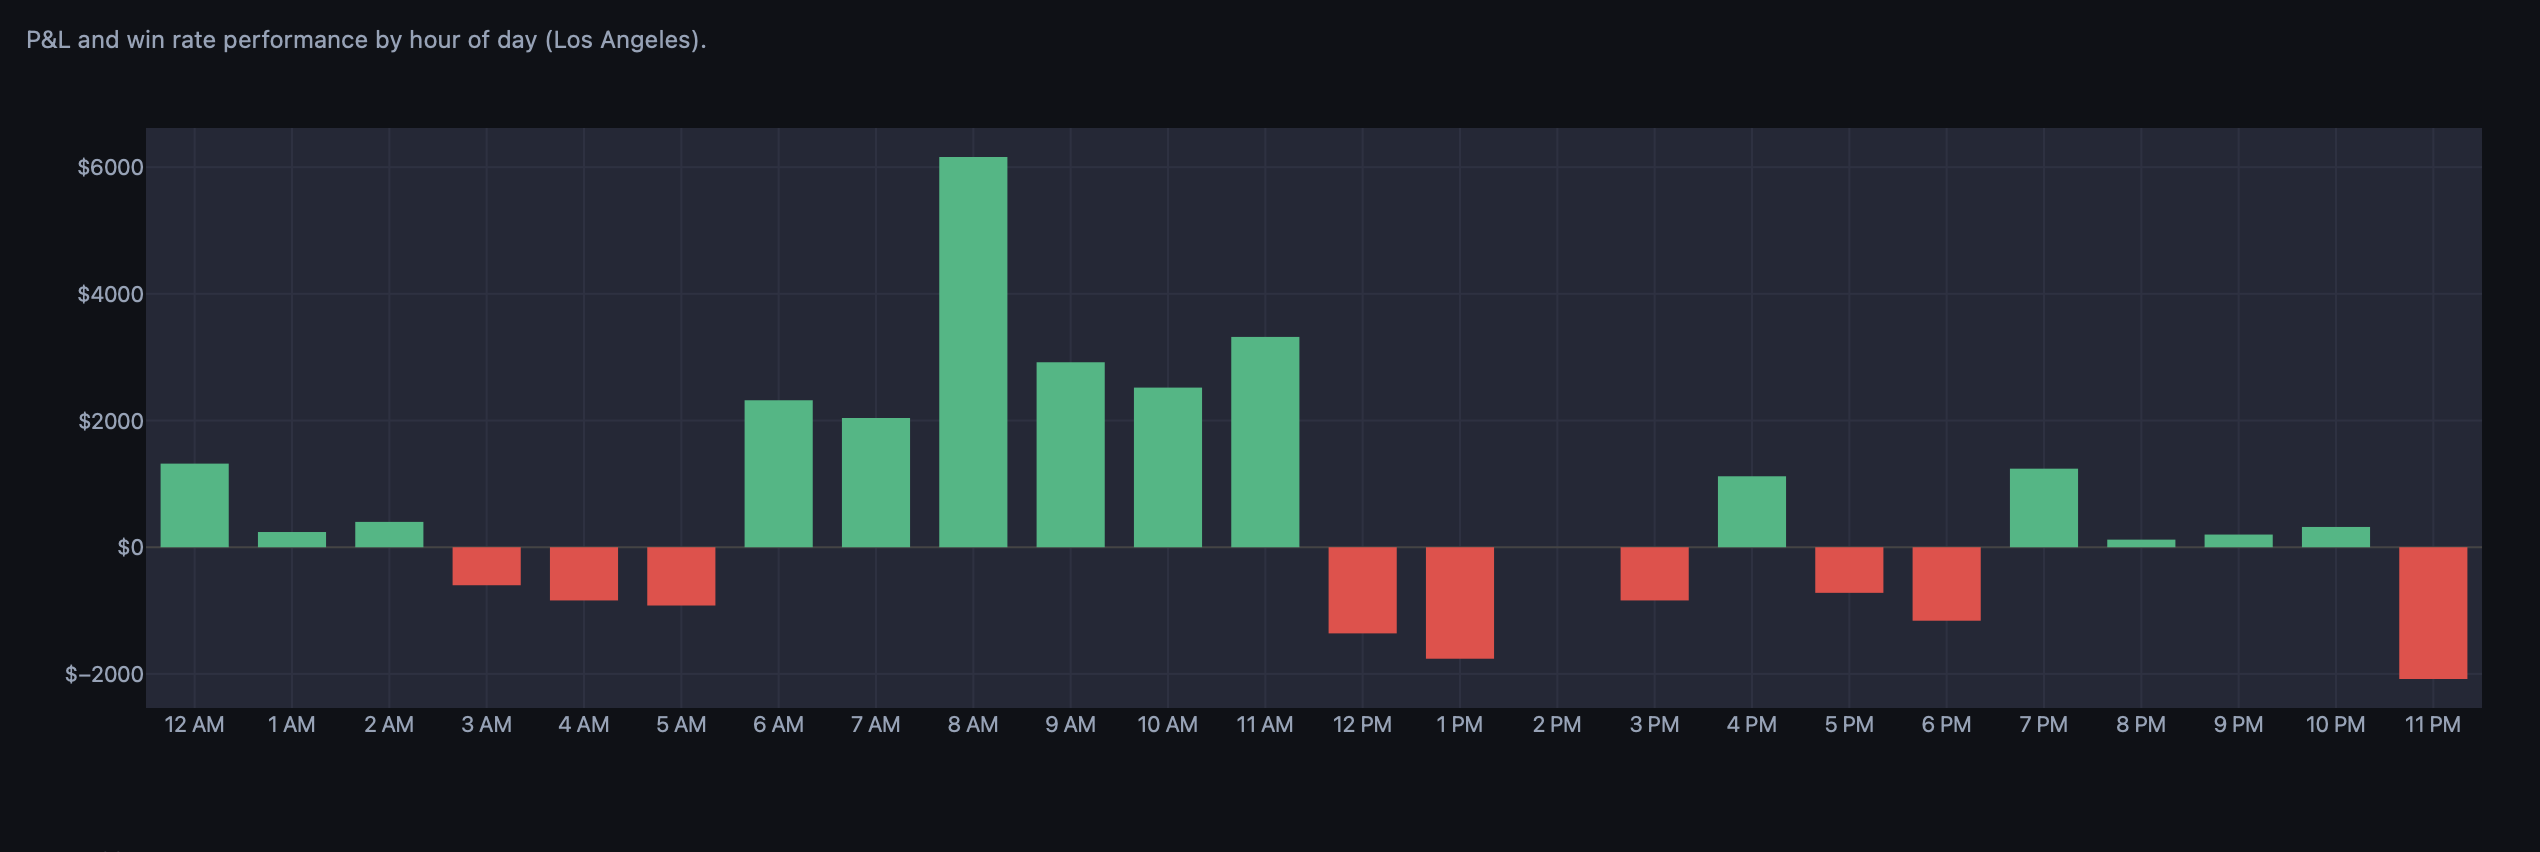
Identify the specific sessions and hours where your strategy outperforms — and the chop windows to avoid — without touching your signal logic.
Monte Carlo resampling, Value at Risk, and drawdown-event analysis turn your forward-test record into a real risk profile — so position sizing is a decision, not a guess.
From a TradingView alert to live analytics — no manual journaling, no spreadsheets.
Your TradingView strategy fires buy/sell alerts on any instrument — futures, indices, crypto.
Each alert is captured instantly with ticker, action, price, and timestamp. Deduplication built in.
P&L, win rate, drawdown, hourly patterns, comparison — then the optimizer finds your best target, stop, and hours.
| Dimension | Backtesting | Forward testing |
|---|---|---|
| Market data | Historical (past) | Live, real-time |
| Overfitting risk | High | None |
| Price source | Simulated fills | Live signal prices |
| Results credibility | Can be cherry-picked | Verified & timestamped |
| Time required | Minutes | Days to weeks |
| Capital at risk | None | None (paper) |
| Psychological realism | None | Real-time results |
Field notes on forward testing, execution parameters, and reading your own data honestly.
Backtesting feels productive. Forward testing feels slow. But the traders who survive their first year almost always did one thing differently.
Every trader discovers backtesting early. You load up historical data, tweak a few parameters, and watch the equity curve climb. It feels like progress. The numbers look good. You feel ready.
Then you go live, and everything falls apart.
Backtesting answers one question: "Would this strategy have worked in the past?" But it ignores the two variables that actually determine whether you make money: your execution discipline and your emotional response to real losses.
Forward testing bridges that gap. It forces you to watch your strategy operate on live data, in real time, with no ability to skip ahead or adjust parameters after the fact. Every trade is timestamped. Every result is permanent.
Traders who complete a proper forward test — at least 50 trades with documented results — have something rare: evidence. Not a curve-fitted backtest. Actual, verified, timestamped proof that their strategy works in current market conditions. That evidence becomes your conviction when the inevitable drawdown arrives. And drawdowns always arrive.
A forward test without structure is just watching charts. Here is a systematic framework that turns observation into actionable data.
Write down every entry condition, exit condition, position size rule, and time filter before running a single trade. If the rules are not specific enough to automate in TradingView, they are not specific enough to test.
Decide in advance how many trades you need before evaluating. A minimum of 50 trades is recommended for statistical relevance, though 100 gives much stronger confidence. Commit to this number before you start — not after the first losing streak.
Manual trade journals introduce bias. You forget to log losing trades, round numbers in your favor, or skip days when you were distracted. Automated webhook capture eliminates all of these problems.
Track win rate by time of day, by instrument, by day of week. Look at maximum drawdown duration. Identify which sessions are profitable and which are consistently negative. This granular data tells you where to optimize.
Check your dashboard weekly to stay engaged, but do not make strategy changes based on a single week of data. Wait until you hit your target sample size, then review the full picture.
A dashboard full of numbers means nothing if you do not know which metrics matter and which ones mislead.
Profit factor is gross profit divided by gross loss. Above 1.0 means net profitable. Above 1.5 is solid. Above 2.0 is excellent. If your forward test shows a profit factor below 1.0 after 50+ trades, the strategy is not working in current conditions — regardless of what the backtest showed.
A 40% win rate strategy can be highly profitable if the average win is three times the average loss. Conversely, a 70% win rate strategy can lose money if one bad trade wipes out ten small wins. Always look at win rate alongside average win and average loss size.
Your backtest might show 5% max drawdown; your forward test shows 12%. That gap is the difference between simulated fills and real conditions. The forward-test drawdown is the number to use for risk management.
If your hourly analysis shows consistent losses between 12 PM and 1 PM, consider turning off alerts during that window. This single optimization can dramatically improve performance without changing the core logic.
A 35% win rate is not necessarily a bad strategy. It might just be running at the wrong time, taking profits too early, or holding through drawdowns it should have cut.
Most traders spend all their time optimizing entry signals. But the entry is only half the equation. When to take profit, when to cut losses, and which hours to trade often has a bigger impact on the bottom line than the signal itself.
No target means you capture big winners but give back gains on reversals. Too tight caps your upside. The optimal target depends on your strategy's average win size, its tendency to give back gains, and how often it produces outlier days.
A daily drawdown stop prevents one bad session from erasing a week of gains. Too tight and you stop out of trades that would have recovered; too loose and it never triggers. The right stop is specific to your loss distribution.
A strategy that loses from 12–2 PM but prints from 9–11 AM is not a bad strategy — it is a good strategy running during bad hours. Restricting to profitable hours can transform a breakeven strategy into a consistently profitable one.
Under 50 trades, you are reading tea leaves. At 100, patterns stabilize. At 200+, you can trust the recommendations. Collect at least 200 forward-test trades, then optimize — and keep testing to verify the parameters hold.
Indicators show signals but cannot fire alerts or track P&L. Converting to a strategy unlocks automated forward testing.
Indicators use study() or indicator() and can only plot visuals. Strategies use strategy() and can generate orders, track positions, calculate P&L, and fire webhook alerts. You need a strategy to forward test.
// Before (indicator):
indicator("My Signal", overlay=true)

// After (strategy):
strategy("My Signal", overlay=true,
     default_qty_type=strategy.fixed,
     default_qty_value=1,
calc_on_every_tick=false)if buySignal
strategy.entry("Long", strategy.long)
if sellSignal
strategy.entry("Short", strategy.short)barmerge.lookahead_off and calc_on_every_tick=false.pyramiding=0 to prevent stacking entries.Connect your TradingView strategy to the dashboard with webhook alerts. Works with any platform that supports HTTP POST.
TradingView alerts support placeholders replaced with real values when the alert fires:
StrategyName: {"ticker": "{{ticker}}", "action": "{{strategy.order.action}}", "price": "{{strategy.order.price}}"}The name before the colon identifies the strategy; the JSON carries the trade details.
Alt+Ahttps://pnlytics.io/webhook/YOUR_TOKENThe webhook accepts POST JSON from any source and normalizes 35+ field-name variations — TradersPost, 3Commas, Bybit, Alpaca, and custom bots work without format changes. Check https://pnlytics.io/health to confirm the alert count, then watch the trade appear in Recent Trades.
Every plan is free while we're in open beta. The paid tiers below are what pricing becomes at launch.
Connect a TradingView alert and watch your first trade appear in real time — in a few minutes.
Join the beta — it's free